Using butterfly in an operational data pipeline
Source:vignettes/articles/butterfly_in_pipeline.Rmd
butterfly_in_pipeline.RmdThis article is a simplified demonstration of a real operational data pipeline we are implementing at the British Antarctic Survey called asli-pipeline. You can inspect the full source code of this pipeline in the repository: asli-pipeline repository (Zwagerman & Wilby).
This package was originally developed to deal with ERA5’s initial release data, ERA5T. ERA5T data for a month is overwritten with the final ERA5 data two months after the month in question.
Usually ERA5 and ERA5T are identical, but occasionally an issue with input data can (for example for 09/21 - 12/21, and 07/24) force a recalculation, meaning previously published data differs from the final product.
In a pipeline that generates ERA5-derived data, and continually updates and publishes this data, we therefore need to robustly ensure that previous ERA5 data changing does not affect our published outputs.
Pipeline overview
Consider a classic input/output (I/O) data pipeline where we read in data from an external source, perform some sort of calculation to it, and transfer the output to a different location.

A simple diagram showing the steps in a generic data pipeline.
We use a pipeline to calculate the ‘Amundsen Sea Low Index’, or ASLI. The Amundsen Seas Low (ASL) is a highly dynamic and mobile climatological low pressure system located in the Pacific sector of the Southern Ocean. If you are interested in ASLI, and why these values are significant for environmental forecasting, please refer to Hosking et al. (2016).
In our case, we run this pipeline on a monthly basis:

A diagram showing the steps in our British Antarctic Survey data pipeline to calculate and publish the Amundsen Sea Low Index dataset.
To generate the ASLI dataset, we read in ERA5 mean sea level
pressure, perform some calculations using the asli python
package (Hosking & Wilby), and move our results to the UK Polar Data Centre
(PDC), where our dataset will be published and minted with a
Digital Object Identifier (DOI). Our aim is to update
this dataset on a monthly basis, either appending new rows to it, or
re-writing the dataset entirely.
But remember, any change in previous ERA5 data, will also change the results of all our previous ASLI calculations.
If this happened and we:
- overwrite our dataset, we would be changing values in an already-published dataset.
- append our existing dataset, anyone attempting to reproduce our methods would get different results.
Either way, this would invalidate our DOI and force republication.
Keeping up-to-date with the Climate Data Store’s Forum to monitor changes would be a time-consuming task, and not a reliable way to detect changes.
Verification using butterfly in a pipeline
To maintain the integrity of our published dataset, we need to impose robust checks to ensure our new results match our published data, where we expect it to.
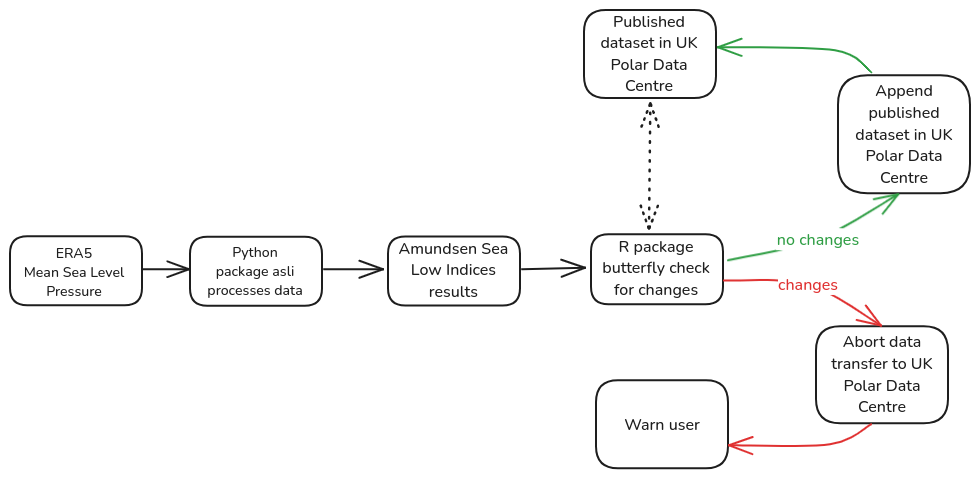
A diagram showing the steps in our British Antarctic Survey data pipeline to calculate and publish the Amundsen Sea Low Index dataset, while using butterfly to check for unexpected changes in our results.
… and this is where butterfly comes in.
When developing a pipeline, we separate our data, configuration and code.
Data
For the purpose of this article, details of the dataset itself are not important. But for reference, below is a subset of the ASLI dataset:
| time | lon | lat | ActCenPres | SectorPres | RelCenPres | DataSource |
|---|---|---|---|---|---|---|
| 2024-01-01 | 201.50 | -74.75 | 979.0750 | 985.1078 | -6.032776 | ERA5 |
| 2024-02-01 | 258.75 | -70.00 | 976.8563 | 981.9796 | -5.123352 | ERA5 |
| 2024-03-01 | 190.75 | -71.25 | 975.3262 | 987.1877 | -11.861511 | ERA5 |
| 2024-04-01 | 193.75 | -70.75 | 970.4094 | 980.2413 | -9.831970 | ERA5 |
In the subsequent month we run the pipeline again, and a row is added, because a new month of ERA5 data has since been released.
As you can see, all data for previous months are also included in the data:
| time | lon | lat | ActCenPres | SectorPres | RelCenPres | DataSource |
|---|---|---|---|---|---|---|
| 2024-01-01 | 201.50 | -74.75 | 979.0750 | 985.1078 | -6.032776 | ERA5 |
| 2024-02-01 | 258.75 | -70.00 | 976.8563 | 981.9796 | -5.123352 | ERA5 |
| 2024-03-01 | 190.75 | -71.25 | 975.3262 | 987.1877 | -11.861511 | ERA5 |
| 2024-04-01 | 193.75 | -70.75 | 970.4094 | 980.2413 | -9.831970 | ERA5 |
| 2024-05-01 | 197.75 | -73.75 | 969.6675 | 986.0841 | -16.416565 | ERA5 |
This is what will be submitted to the PDC.
Configuration
Firstly let’s look at our configuration, which is stored in an
ENVS file. This determines the locations of our input data,
our output data and where we will eventually publish our data, among
other useful parameters:
## Directories
# Should not need editing, but you can do so if you wish
# Location that pipeline is stored, referenced by most scripts
export PIPELINE_DIRECTORY=$( cd -- "$( dirname -- "${BASH_SOURCE[0]}" )" &> /dev/null && pwd )

# Set input and output directories for downloaded files (DATA_DIR)
# And calculation results (OUTPUT_DIR)
export DATA_DIR=${DATA_DIR:-${PIPELINE_DIRECTORY}/data/ERA5/monthly}
export OUTPUT_DIR=${OUTPUT_DIR:-${PIPELINE_DIRECTORY}/output}

# Specify virtual environment so it does not need to be called prior to running
export ASLI_VENV=${ASLI_VENV:-${PIPELINE_DIRECTORY}/asli_env/bin/activate}

# Setting rsync location, where we will eventually move our data should there
# Be no errors
export RSYNC_LOCATION=""

# Set dates and current year for iteration purposes
export CURRENT_DATE="`date --utc +"%Y_%m_%d"`"
export CURRENT_YEAR="`date --utc +"%Y"`"

## Data querying parameters
# ERA5 Downloading parameters, we are only selecting the current year, for the
# sake of computational efficiency
export START_YEAR=2024
export END_YEAR=${CURRENT_YEAR}
export DATA_ARGS_ERA5="-s ${START_YEAR} -n ${CURRENT_YEAR}"

# FILE_IDENTIFIER will what the output filename is called
# ie asli_calculation_$FILE_IDENTIFIER.csv
# Depending on how you are organising your files, you might want this
# To be the CURRENT_YEAR, CURRENT_DATE or another unique ID
export FILE_IDENTIFIER=${CURRENT_YEAR}
Code
Now that we have set our configuration, let’s inspect the shell
script which actually runs our pipeline,
run_asli_pipeline.sh.
#!/bin/bash
set -e

# Read in config file
source ENVS

# Activate virtual environment
source ${ASLI_VENV}

# Put all relevant directories in a list
DIR_LIST=($DATA_DIR $OUTPUT_DIR)

# Create them if they do not exist
for dir in ${DIR_LIST[@]};
do
  if [ ! -d $dir ]; then
    mkdir -p $dir
    echo "Created $dir"
  fi
done
The above concerns setting up our pipeline with input and output directories, as well as fetching all environmental variables.
Next is the calculation step, using the functionality from the
asli package:
# Fetch land sea mask, automatically writes in data directory
# Everything is pre-set in asli functions, no arguments needed for our purpose
asli_data_lsm

# Downloading latest ERA5 data, provide information to the user
echo "Requesting with the following arguments: $DATA_ARGS_ERA5".
asli_data_era5 $DATA_ARGS_ERA5

# Run calculation, specifying output location
asli_calc $DATA_DIR/era5_mean_sea_level_pressure_monthly_*.nc -o $OUTPUT_DIR/asli_calculation_$FILE_IDENTIFIER.csv
Lovely, we now have our calculations ready in
$OUTPUT_DIR, to rsync to a location given to us by the PDC.
To do so for the first time, we will run:
Let’s pretend this was our first submission to the PDC. For any
subsequent submission, we will want to use butterfly to
compare our new results with the file we have just submitted to the
$RSYNC_LOCATION, to make sure previous values have not
changed.
Incorporate R and butterfly into a shell-scripted
pipeline
We are going to implement this in an R script called
quality_control.R, but we will have to provide it with our
new calculations and the calculations we did previously and transferred
to $RSYNC_LOCATION, like:
Rscript quality_control.R "$OUTPUT_DIR/asli_calculation_$FILE_IDENTIFIER.csv" "$RSYNC_LOCATION/asli_calculation_$FILE_IDENTIFIER.csv"Here, $OUTPUT_DIR/asli_calculation_$FILE_IDENTIFIER.csv
is our most recent calculation, in quality_control.R this
will be referred to as args[1]. The previous calculation,
$RSYNC_LOCATION/asli_calculation_$FILE_IDENTIFIER.csv, will
be args[2].
Let’s have a look at quality_control.R now. We started
off with making this script executable by the shell, provide the user
with some instructions on how to use the script, and by obtaining the
arguments it was given in args.
#!/usr/bin/env Rscript
# Usage: Rscript 02_quality_control.R <current-file-path> <existing-file-path>

# Obtain passed arguments
args = commandArgs(trailingOnly=TRUE)
Next, we will test if those arguments were actually provided, and if so we read in our files:
# Test if there is two arguments: the output and previous file
if (length(args)!=2) {
  stop(
    "Please provide the output file, and the file it is being compared to", call.=FALSE
  )
} else {

current_output <- readr::read_csv(
  args[1]
)

existing_file <- readr::read_csv(
  args[2]
)

}
Great! Now that the files have been read in, we can start our
verification using butterfly.
In this case, we will use butterfly::loupe() to give us
our report, and return either TRUE (previous data has not changed, we
are happy to proceed) or FALSE (a change in previous data has been
detected, and we should abort data transfer).
# Use butterfly to check there are no changes to past data
qa_outcome <- butterfly::loupe(
  current_output,
  existing_file,
  datetime_variable = "time"
)

if (!isTRUE(qa_outcome)) {
  stop(
    "Previous values do not match. Stopping data transfer."
  )
}
The last check, if (!isTRUE(qa_outcome)) will only
trigger and stop the entire pipeline if a change has been detected.
The whole game
We’ve inspected every bit of functionality in our pipeline, which can be summarised as:
- Reading in data, calculating asli values, and putting results in an output folder.
- Running verification checks on results in the output folder, and comparing against those in the rsync location.
- Transferring results from the output folder to the rsync location, if verification checks have passed.
A sensible way of organising distinct steps in a pipeline, is to move different components of functionality into their own script. In our case we will have:
01_run_asli_calculations.sh02_quality_control.R-
03_export_file_to_pdc.sh.
Finally, let’s update run_asli_pipeline.sh to make it
easier to read.
#!/bin/bash
set -e

# Read in config file
source ENVS

# Activate virtual environment
source ${ASLI_VENV}

# Put all relevant directories in a list
DIR_LIST=($DATA_DIR $OUTPUT_DIR)

# Create them if they do not exist
for dir in ${DIR_LIST[@]};
do
  if [ ! -d $dir ]; then
    mkdir -p $dir
    echo "Created $dir"
  fi
done

# Run calculations, writes an output file in $OUTPUT_DIR
bash 01_run_asli_calculations.sh

# Check whether our new data has any changes from previously submitted data
Rscript 02_quality_control.R "$OUTPUT_DIR/asli_calculation_$FILE_IDENTIFIER.csv" "$RSYNC_LOCATION/asli_calculation_$FILE_IDENTIFIER.csv"

# If successfuly, export our data to the PDC
bash 03_export_file_to_pdc.sh
And there we are! Importantly, 02_quality_control.R
should be run before 03_export_file_to_pdc.sh.
Because cli::cat_*() warnings are used in
butterfly, these should print to the shell automatically
and allow you to diagnose where differences might have occurred.
cli::cat_abort() will automatically stop a pipeline.
Therefore, any failure in 02_quality_control.R will
prevent our data from reaching its destination.
So what’s next?
So, butterfly did its job, detected changes and stopped
data transfer… now what?
Currently, it is set up to warn the user, who can intervene in the process manually. The next step would be to make the published data static, as we are now no longer appending it. We then supersede it with our new data, and restart the process.
A future aim would be however, to do this automatically:
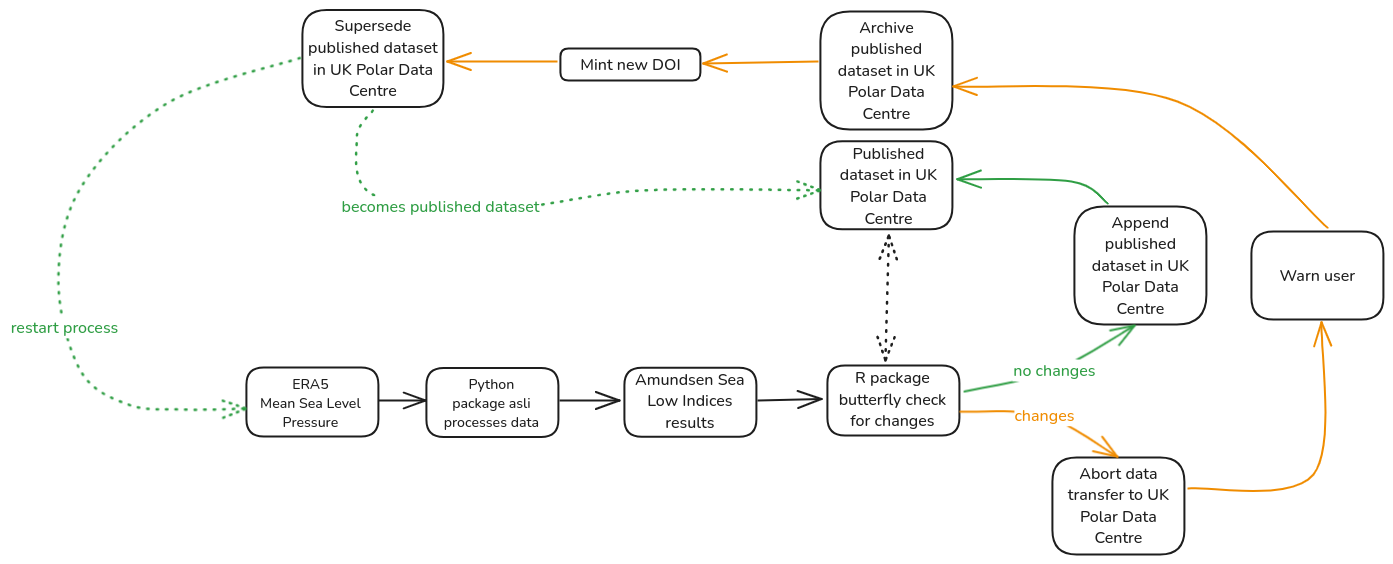
A diagram showing next steps in an automated data processing and publishing pipeline, incorporating automated archival and supserceding.
This is a lot more complex to handle however, especially considering currently DOIs are minted manually, regardless of data state. Perhaps some form of human intervention will always be required, but one can dream!
References
Hosking, J. S., A. Orr, T. J. Bracegirdle, and J. Turner (2016), Future circulation changes off West Antarctica: Sensitivity of the Amundsen Sea Low to projected anthropogenic forcing, Geophys. Res. Lett., 43, 367–376, doi:10.1002/2015GL067143.
Hosking, J. S., & Wilby, D. asli [Computer software]. https://github.com/scotthosking/amundsen-sea-low-index
Zwagerman, T., & Wilby, D. asli-pipeline [Computer software]. https://github.com/antarctica/boost-eds-pipeline